

onitoring SQL Server for Performance, Up-time and other crucial stats is one of the most important tasks you can do in order to keep your database server software running smoothly and efficiently. We’ve compiled a list of the top SQL server performance monitoring tools and software as well as some pricing information as well.
Monitoring and fine tuning a SQL install is a task that all DB Administrators and Engineers need to get under their belt as it will really prove to be beneficial to not only your server hardware, but your end user experience as well.
Some of the main issues that arise when dealing with slow SQL servers include some of the following:
- Database Size:
As the database size grows, the SQL server will need more memory and CPU to read data from the tables, and when the size of each table increases, it slows down the DB operations. Monitoring Database size is extremely important to ensure that Hard-disks don’t run out of space. - Query Structure:
Finding the most expensive queries on the SQL DB will be crucial to the servers performance. Once you’ve identified queries that are taking up the most resources, you can address them to reduce load on server cycles and memory usage before your DB comes to a halt.Finding out which application is causing these expensive queries on your database will help you diagnose the issues behind these queries and remedy them quickly and efficiently. Monitoring these queries will help you identify which host application is causing these issues and potentially help you diagnose these other applications that could be on the verge of crashing as well. - Index Fragmentation:
SQL indexes the database to make searching the DB faster and more efficient. Proper indexing helps you search the DB faster and more efficiently, but when data is modified, deleted or removed, the indexed content gets scattered and the DB becomes fragmented and will result in database degradation. - Performance:
Memory, Cache and paging should be monitored in real-time to ensure your SQL Server software is performing at its optimal rate and not facing bottlenecks.
Here’s Our Top Picks for Database Monitoring & Optimization of 2019:
We’ve put together a list of tools and software that will assist you in monitoring your production SQL database server and all you to get insights into its performance, hardware and other important factors that need to be monitored.
Below is a list of SQL Server Performance Tuning and Monitoring Tools and Software:
- Solarwinds DB Performance Analyzer
- Idera SQL Diagnostic Manager
- Lepide SQL Server Auditing
- Heroix Longitude®
- SQL Power Tools
- Red-Gate SQL Monitor
- Sentry One (SQL Sentry)
- dbForge Monitor by Devart
- Navicat Monitor
1. Solarwinds Database Performance Analyzer for SQL Server
Solarwinds DPA monitors and analyzes your SQL database instances to solve bottlenecks. It uses a Response Time Analysis method to focus on the time between a query requests and the response from the database and analyzes wait types and events to pinpoint the bottlenecks of your db.
Solarwinds DPA has an easy to use interface that will assist you in finding issues quickly and easily within the first screen, as seen below:
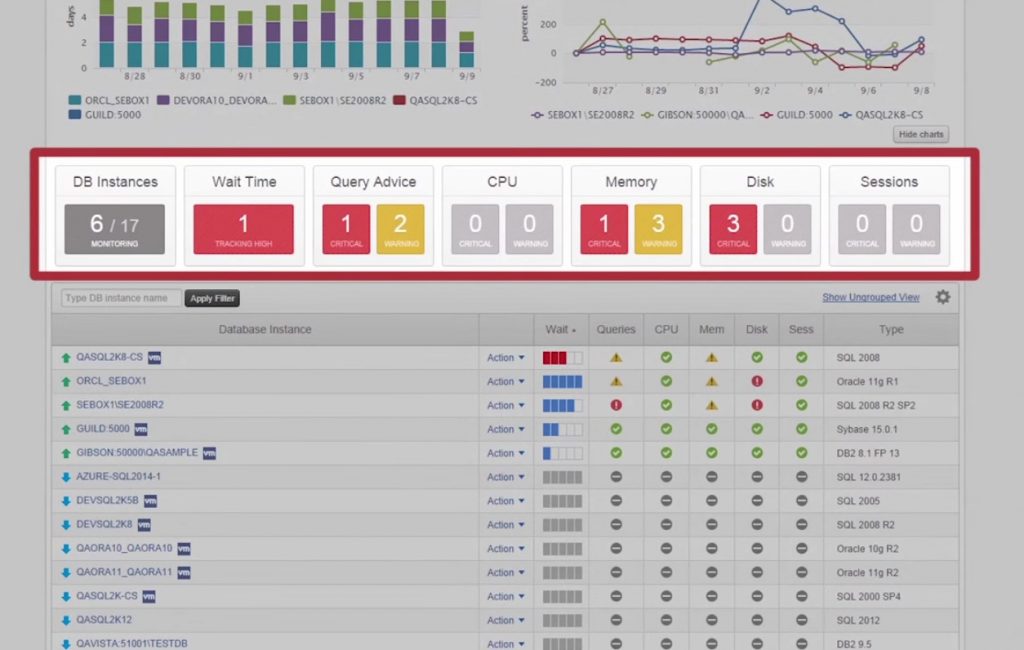
View DB Instances, Wait Times, Query Advice, CPU (Critical/Warning alerts), Memory Alerts, Disk and Sessions.
The Trend dashboard of a certain database instance will show you the Total Wait times (or your choice of either Average or Typical Day wait times) for the users over the course of a months time split up by days. Each color of the graph represents an individual sql statement, which will give you a representation of which SQL statement takes the longest to run.
You can then click on the day you want to analyze for more information about the query that took longer to execute.

With this information, you click on the “more…” link to give you advice about the query, wait events, number of executions and who’s running the query, as well as specific times it has run. You can view historical data for your sql queries by day along with wait times and executions, where you can pinpoint when there are less executions with higher wait times. DPA helps you find issues within SQL quickly with easy to read graphs and specific times of the day/month.
You can also view I/O wait times by which File is being utilized and drill down even further into a specific hour of any given day down to the MINUTE, as seen below:
Some Features of this software include the following:
- Database Tuning Advice to enhance Performance
DPA gives you advice for tuning individual DB instances to ensure its running at its peak performance by analyzing all parameters of an instance and recommending a course of action to optimize certain queries or database instances for peak performance. - Active monitoring of all Active sessions to the Second
Highly Detailed native Polling Engine records exactly everything thats happening within your database instances with no additional load to the database themselves. - Tracks, Monitors and analyzes databases components to pinpoint root problems of performance issues
Automatically Correlates queries, users, files, plans, objects,wait times, storage and date/time/hour/minute to accurately discovery and diagnose problems on the fly. - Single point of Monitoring for all your Database instances and types of DB’s
Supported Database software includes: Oracle, SQL Server, MySQL, DB2, and ASE, either physical in-house, Virtual Machines (Vmware/Hyper-V) and in the Cloud db’s. - Agentless and Highly Scalable
Monitor as many Database instances as you want – from 1 to 1000 instances. Its highly scalable and Agentless. - Integrates easily with Solarwinds Orion® Platform
Use Solarwinds SAM (Server and Application Monitor) to view database information including Nodes and Applications.
We’re just skimming the top with this quick review of Solarwinds DPA and we’d recommend you download a Free 30 Day Trial Copy and test further in your environment. We Highly recommend this product as its specifically designed to granularly monitor, analyze and help you dial in your DB queries and trim those execution times way down.
Official Site and Download: http://www.solarwinds.com/database-performance-analyzer-sql-server
2. Idera SQL Diagnostic Manager

Idera Diagnostic manager provides performance monitoring for SQL databases in both physical and virtual environments, with the ability to see performance statistics, metrics and alerts from Virtual machines and their accompanying host hardware. This includes CPU, Memory, Hard Disk Usage and Space, Network usage and more. Idera also provides provactive monitoring of queries along with transactional sql monitoring and provides you with recommendations for your SQL db.
With an easy to use Web-based interface and mobile app (that can be used with Androids, iPhones, tablets and Blackberry), seeing real-time and historical data about your SQL server instances will allow you to make changes on the fly within the mobile app. Administrative tasks you can do while mobile include View/Kill Processes, Start and Stop Jobs as needed and Run queries to resolve issues.
Other features of this software include easy integration with SCOM using the Management Pack add-on, predictive Alerting system to avoid any False Positive Alerts and a great Query performance monitoring function that identifies queries that are not efficient and performing poorly.
Official Site and Download: https://www.idera.com/productssolutions/sqlserver/sqldiagnosticmanager
3. Lepide SQL Server Auditing
Lepide Auditor suite has a SQL server auditing portion to it that servers as a performance, uptime and activity monitor for your SQL instances. They provide great reporting into your SQL servers that show your most active users and databases, changes to objects, tables and logins. You have the ability to build your own reports based on a number of different parameters and thresholds as you wish.
Lepide offers a trend analyzer feature that helps DB Administrators that helps you pinpoint what changes are being made to the database and by who. This helps you see and track any potential security risks that could arise from wrong permissions or administrator errors/issues. On top of the trend analyzer, they also offer a feature called Sql Server HealthCheck that continuously tracks the vital components of a SQl server and provides real-time tracking for things such as Network connections, CPU Usage and Load, Errors and much more.
Additional Features include:
- Mobile App for viewing a Live Feed of whats happening on an instance that works will any Android or Apple devices
- In Depth reporting features and 50+ Pre-Defined reports for Compliance and System Management
- Ease-to-Use Dashboard that you can Quickly spot Trends, Changes to Databases and real Time alerting for events that occur
Official Site and Download: https://www.lepide.com/lepideauditor/sql-server-auditing.html
4. Heroix Longitude®
Heroix offers a monitoring solution that is touted as “Agentless” out-of-the-box and can monitor SQL Server 7/2000/2005/2008/2012, Oracle 9/10g/11g and MySQL 4.1 and 5.0. Heroix Longitude monitors your databases provactively for crucial performance metrics that will ensure they’re running at the highest rates possible and will alert you if there are issues or bottlenecks that need to be addressed. Pre-configured reports and graphs help you identify issues before or as they arrive to keep your instances highly available.
Official Site and Download: http://www.heroix.com/solutions_database.html
5. SQL Power Tools

SQL Power Tools (sqlpowertools.com) is another “Agentless” database monitoring solution that gives you the ability to drill down into 120+ different metrics of your server. They are very big on being extremely lightweight with almost no overhead for monitoring – less than 1%, according to their website.
Features of this software include the following:
- Wait types
- SQL wait times
- I/O wait times
- Blocking and Deadlocks
- Disk bottlenecks & Temp Database bottlenecks
- SQL performance and Plan Mining
- Top N SQL
- Performance Counters
- Disk mirroring
- Availability groups
- Procedure and Buffer Cache
- Database Size and Disk Drive Space
- Low Disk Space and High Disk Space Usage
- Index fragmentation
- SQL Agent jobs
- Performance Baselines
Official Site and Download:
6. Red-Gate SQL Monitor
Red-Gate provides an array of tools that helps your manage, monitor, change, manipulate and optimize sql based databases.
We’ll be covering the SQL Monitor portion of their offerings as some of the others don’t really apply to this article.
Red-gate provides a great dashboard to view all of your database instances in one web-based interface that gives you control and access wherever you are at. You have the ability to access all your SQL databases within seconds without having to VPN into your network or anything like that.
This easy-to-use dashboard will help you drill down further into statistics about your instances including Wait times, CPU usage and Disk I/O within 2 clicks.
Red-gate also comes with 40 pre-configured, fully customizable alerts that can be quickly adapted to your setup and instances and give you the flexibility you need for alerting and monitoring of critical performance and operational metrics.
You have the option to setup alerts either on a Server-level, Instance-level or Database-level if you wish, quickly and easily without having to go through a whole process of manually configuring alerting options.
Pre-configured alerts and thresholds include:
- High CPU or Memory Resource Usage
- Disk Space Running Low (Transaction logs or Database Disk)
- Performance Issues of Queries
- SQL Errors and Issues, including Deadlock and Blocking
- Hanging Backups in Sql Server
- Skewed Values for Databases, Instance or Object-Level properties
- Issues with Availability Groups
More Info can be found at their Official Site and 14 Day Trial Download:
http://www.red-gate.com/products/dba/sql-monitor/
7. Sentry One (SQL Sentry)
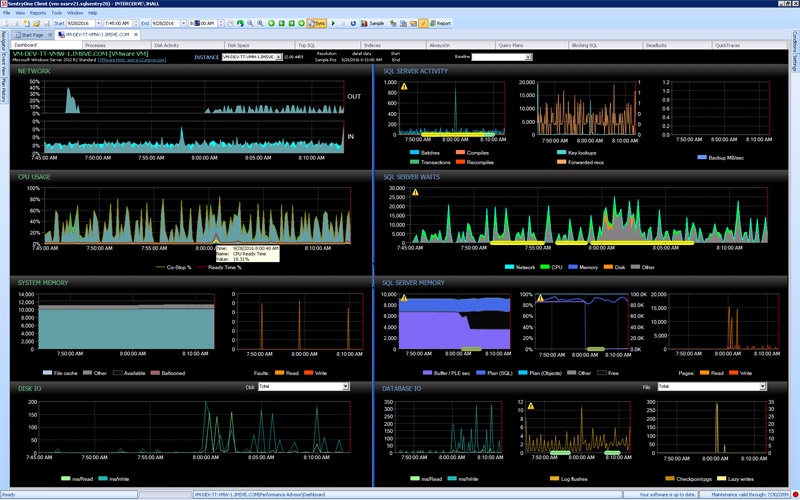
Sentry One, provides a Real-time dashboard of all your the critical SQL components and services that are neatly presented in a way that will help you manage and ensure high-availability of your SQl instances. SQL Sentory also gives you the option to view historical data of your server to compare to actual real-time stats that will further assist you in baselining and optimizing your database instances and servers.
Dashboard includes some of the following metrics for quick analysis and viewing in real-time or historical, depending on which mode you choose:
- Network Percentage Usage (Inbound/Outbound)
- Cpu/Processor Usage
- SQL server activity (including Batches, Transactions, Compiles and Recompiles, Key lookups and Forwarded Recs)
- SQL Server Network waits, CPU waits, Memory Waits and Disk waits
- System Memory Usage for File Cache and Balloning, along with Faults for Read/Write
Sentry offers a wide variety of features as well as many of the other offerings listed above, including highest or most expensive queries on the DB, Block chain Analysis, Deadlock Analysis, Vmware and Hyper-V Support (including Memory and CPU usage of Hosts/Hypervisors), Event Calendar for viewing and managing SQL server processes, Web/Mobile Accessability, Extensive Reporting and Alerts and much more.
Additional Features Sentry SQL include:
- Index Analysis (for Defragmentation, Fill Factor Adjustments, Automatic Maintenance)
- AlwaysOn Monitoring
- Sql Server Blocking and Deadlocks
- Job Chaining features
- SSIS Logging and Support
- Performance Reporting (Global to Individual Counters)
More Info can be found at their Official Site and 15 Day Free Trial Download:
https://www.sentryone.com/platform/sql-server-performance-monitoring
8. dbForge Monitor by Devart
Devart offers numerous solid tools that help users develop, manage, analyze, administrate and optimize SQL databases. Speaking of Devart tools designed for monitoring SQL Server performance, we’d like to highlight dbForge Monitor, a powerful add-in for SSMS.
dbForge Monitor allows you to carry out SQL Server diagnostics such as detecting the most expensive queries, performance bottlenecks, waiting tasks, and more, and get the broad picture of all SQL Server processes.
The main dbForge Monitor features for quick and comprehensive monitoring SQL Server performance include the following ones:
1. User-friendly and informative dashboard to never miss a thing taking place on SQL Server
Here at the Overview tab, users can observe SQL Server processes from multiple angles including but not limited to the following metrics:
- Memory Utilization
- CPU Utilization
- Read and Write Latencies
- Disc Activity
- IO latency, etc.
2. The data input/output tab to effortlessly view statistics of the read and write operations for each database file.
Using this tab, users can track the total amount of data reads and writes as well as IO operations and read/write latency.
3. The Wait Stats tab to generate the list of waiting tasks and identify the resources that slow down the server
4. An SQL query performance analyzer, included to dbForge Monitor, to find and optimize poorly performing queries that overload the system
This tool also offers the ability to see the query text and query profiling data that help users edit the most expensive queries and make SQL Server processes blazing fast and more productive.
Official Site and Download:
https://www.devart.com/dbforge/sql/monitor/
9. NaviCat Monitor
Navicat Monitor is an server-based database monitoring tool that supports a variety of database servers including MySQL, MariaDB and Percona Server.
It is also compatible with cloud databases like Amazon RDS, Amazon Aurora, Oracle Cloud, Google Cloud, Microsoft Azure, Alibaba Cloud, Tencent Cloud and Huawei Cloud. Navicat Monitor 2.0 (currently in beta) adds SQL Server to the list and packs a lot of new functionality as well.
Navicat Monitor employs an “agentless” architecture, which means that it accesses monitored servers remotely. This provides two benefits:
- Navicat Monitor can be installed on any local computer or virtual machine and does not require any software installation on the servers being monitored.
- It can be accessed from anywhere via a web browser. With web access, you can easily keep track of your servers around the world, around the clock.
Navicat Monitor collects process metrics such as CPU load, RAM usage, and a variety of other resources over SSH/SNMP, at regular intervals.
These are presented via a rich set of real-time and historical graphs that give you a detailed view of each server load and performance and allow you to drill down into server statistic details.
Pro’s:
There’s a lot to love about the latest release, but two new features stood out most:
The first is the new dashboard. It provides a wealth of server statistics, including a detailed view of each server load and performance regarding its availability, disk usage, network I/O, table locks and more.
It’s ideal for tracking deviations in performance and traffic among server instances, as well as examine possible solutions and adjust your server settings.
The second stand-out feature is the new long running queries feature. Accessible from the Instance Details screen, the Long Running Queries include a wide variety of diagnostic information.
In addition to all of the longest running queries based on time, the Long Running Queries screen includes stacked bar charts for execution times, Waits, Operations, DB Users, and more.
Con’s:
While still in beta, I wasn’t able to connect to my Azure SQL Database instance in Navicat Monitor 2.0.
It’s likely caused by a difference in Azure architecture compared to the traditional SQL server. Microsoft Azure has no “master” database, so, for now, the monitor cannot get the data from SQL server.
This issue may very well be resolved before version 2.0 officially hits the market.
Official Site, Download and Price:
Free Trial can be Downloaded and used for a full 30 Days.
If you want the Full version, you can purchase a standard license for $25.99 (monthly), $259.99 (yearly), or $399.00 (perpetual).
There are also non-commercial licenses available for only $9.99 (monthly), $99.99 (yearly), or $159.00 (perpetual).
https://www.navicat.com/en/products/navicat-monitor
Conclusion
There are also plenty of Microsoft based monitoring tools that are native to Windows, but they are not nearly as encompassing as the tools mentioned above, but will still get the job done.
If you are interested in a Microsoft based tool/s, we recommend you check out some of the articles from MSSqlTips.com, including this one about Perfmon for Sql Server, this one about using Server Side trace for Performance Monitoring and this article about using Sql Server DB engine Tuning Advisor for Performance monitoring.
This article will discuss some individual tools that will assist you in monitoring and performance optimizing your SQL instances, but none will be nearly as thorough as the software packages and suites mentioned above.
For an all encompassing solution, grab one of the software packages or suites from above to ensure your have the best SQL Monitoring tool for your environment. Ensuring that your database is running at peak performance and is highly available is not worth skimping out on when looking for a monitoring solution.
We’ve seen it in our own environment and recommend everyone employs one immediately.
Source: https://www.pcwdld.com/best-sql-server-performance-monitoring-tools